

Purpose
The goal is to determine the most appropriate regression model so that using only the information in the photo real values for the dimensions of the teeth of the three-dimensional model can be reproduced, and vice versa.
Material and Methods
Two parallel studies were conducted in a group of 61 people with preserved natural dentitions. Maxillary dental gypsum models were cast and photo shot with a camera and a mobile phone at the same focal length. All photos and gypsum models were digitally measured. Ratios between the width and height of the frontal teeth were deducted.
Results
Regarding the width and height of the upper central incisors, lateral incisors and the canine teeth determined on SLR, mobile camera and mobile camera with 2h zoom images, it can be seen that the best model is the quadratic: The value for R Square is the highest, indicating a better match between the analyzed data and the model. The cubic model is close to it and with good features. Height of the teeth can be determined with greater accuracy from the photo, rather than the width.
Conclusion
Measurements made on digital photos in a front aspect, may be used to determine the real values in true-to-reality digital model and vice versa. For this purpose, the quadratic regression model is most suitable. In this sense, it could be implemented in novel dental software as a method for converting the two-dimensional dental design into three-dimensional true-to-reality digital model.
Can dimensions based on true-to-reality digital images be used to reproduce the real values in 3D model and vice versa?
Introduction
Many studies concerning aesthetics in dentistry are based on photographs.1, 2 Digital technologies are increasingly used in the analysis and implementation of the smile design.3,4 Measurements on photographs are often used to determine the proportion of teeth in the visible area of the dentition.5 Despite the strict compliance with standardized conditions, data obtained through dental photography may not accurately correspond to reality. There are differences between photo and clinical measurements on the face, mostly in soft tissue parameters.6 Using easily applicable facial markers, frontal and lateral views can be standardized to obtain comparable results.7, 8
Since the size of the teeth of the photos in the frontal facial aspect does not correspond to the actual size of the teeth in the mouth, it is imperative to implement an algorithm to provide for this discrepancy. Ignoring this aspect in designing the digital smile design can lead to substantial errors in the information provided to the dental laboratory and to the design of prosthetic structures of inadequate volume and dimensions.
This requires the demand of coefficients or a mathematical model to allow the parameters measured in the photos to be recalculated and to determine the real dimensions of the teeth, respectively, to offer real parameters of the proportions of the teeth in the future prosthesis.
For this purpose, a regression analysis of the data with a dependent variable was made—the value measured by the patterns and the independent variable – the value measured by the photos. The regression analysis is done separately for men and women, respectively, for the left and right segments. All models that are supported by IBM SPSS Statistics are analyzed.
Purpose
The goal is to determine the most appropriate regression model so that only by the information in the photo can we reproduce the real values for the dimensions of the teeth of the three-dimensional model and vice versa.
Material and Methods
Two parallel studies in the same group of people were conducted and compared. A total of 61 persons aged between 18 and 30 with preserved natural dentition, without gingival recessions, orthodontic anomalies or prosthetic restorations in the frontal area of the maxilla were selected and examined.
Maxillary impressions were taken with standard trays and alginates. Type 3 dental stone models were cast. Casts were positioned on a horizontal model stand with a sticker measuring 1cm/1cm, with every millimeter graduated.
They were photo shot at standard conditions with a camera equipped with 60mm macro lens at focal length 18.5 cm, aperture speed 125 and aperture F-22, and also with a mobile phone iPhone X equipped with diode photograph light. Mobile photos were taken at the same focal length of 18.5 cm without and with 2x digital zoom. The difference in the shooting distance between the focal lengths, a 100mm macro lens used at approximately 45cm from the subject, will have the same magnification as a 60mm lens used at only 19cm from the subject.
All photos were measured using AutoCAD software (Autodesk) with an accuracy of 0.01 mm. They were framed so that all frontal teeth to the distal edges of the second premolars were visible. The same measurements were made on the gypsum models.
Results
Crown width and height of each front tooth, directly on the models and photos taken under standardized conditions, were measured.
The data obtained are used to determine the real sizes according to the visible parts of the upper front teeth. Distortion of 2.8-38.6%, ranging within 3 mm in widths and heights ranging within 1 mm or 4.5-9.1% less than those obtained on gypsum models, was established (Table 1).
Table 1: Mean values of crown width and height of front teeth found after the measurement on models and digital photos taken under standardized conditions.
| number 120 | MODEL mm | DSLR mm | difference | MDP mm | difference | ZOOM mm | difference | |||
| mm | % | mm | % | mm | % | |||||
| Central incisor | ||||||||||
| Width-Average value | 8,14 | 7,91 | 0,23 | -2,8 | 7,91 | 0,48 | -5,9 | 7,67 | 0,48 | -5,9 |
| St. deviation | 0,76 | 0,56 | 0,56 | 0,56 | 0,95 | 0,58 | 0,95 | |||
| Height-Average value | 9,24 | 8,86 | 0,42 | -4,5 | 8,86 | 0,43 | -4,7 | 8,81 | 0,43 | -4,7 |
| St. deviation | 1,05 | 0,93 | 0,66 | 0,93 | 1,37 | 0,97 | 1,37 | |||
| Lateral incisor | ||||||||||
| Width-Average value | 6,28 | 5,28 | 0,99 | -15,8 | 5,28 | 1,21 | -19,3 | 5,06 | 1,21 | -19,3 |
| St. deviation | 0,82 | 0,55 | 0,71 | 0,55 | 0,92 | 0,53 | 0,92 | |||
| Height- Average value | 7,91 | 7,48 | 0,46 | -5,8 | 7,48 | 0,55 | -7,0 | 7,36 | -,55 | -7,0 |
| St. deviation | 1,02 | 0,82 | 0,52 | 0,82 | 1,23 | 0,84 | 1,23 | |||
| Canine tooth | ||||||||||
| Width-Average value | 7,20 | 4,42 | 2,78 | -38,6 | 4,42 | 3.00 | -41,7 | 4,20 | 3.00 | -41,7 |
| St. deviation | 0,68 | 0,55 | 0,77 | 0,55 | 0,84 | 0,54 | 0,84 | |||
| Height- Average value | 8,96 | 8,16 | 0,82 | -9,1 | 8,16 | 0,85 | -9,5 | 8,10 | 0,85 | -9,5 |
| St. deviation | 1,21 | 1,01 | 1,62 | 1,01 | 1,59 | 1,13 | 1,59 |
The data from the two measurements were subjected to a comprehensive mathematical comparative analysis including correlation and regression analysis (Table 2).
Table 2: Presents the data from the regression analysis of the width of the central incisors determined on SLR images.
Model Summary and Parameter Estimates
Dependent variable: width of central incisor – determined on model
| Equation | Model Summary | Parameters assessment | |||||||
| R Square | F | df1 | df2 | Sig. | Constant | b1 | b2 | b3 | |
| Linear | ,446 | 94,896 | 1 | 118 | ,000 | 1,064 | ,895 | ||
| Logarithmic | ,436 | 91,208 | 1 | 118 | ,000 | -6,158 | 6,925 | ||
| Inverse | ,424 | 86,776 | 1 | 118 | ,000 | 14,885 | -53,042 | ||
| Quadratic | ,464 | 50,582 | 2 | 117 | ,000 | 16,529 | -3,057 | ,251 | |
| Cubic | ,462 | 50,272 | 2 | 117 | ,000 | 10,947 | -1,000 | ,000 | ,010 |
| Compound | ,432 | 89,732 | 1 | 118 | ,000 | 3,417 | 1,115 | ||
| Power | ,423 | 86,545 | 1 | 118 | ,000 | 1,413 | ,846 | ||
| S | ,412 | 82,622 | 1 | 118 | ,000 | 2,917 | -6,485 | ||
| Growth | ,432 | 89,732 | 1 | 118 | ,000 | 1,229 | ,109 | ||
| Exponential | ,432 | 89,732 | 1 | 118 | ,000 | 3,417 | ,109 |
Regarding the width of the central incisors, it can be seen that the best model is the quadratic: y = a + b1 * x + b2 * x ^ 2 = 16,529 – 3,057x + 0,251x2. Here, the value for R Square is the highest, indicating a better match between the analyzed data and the model. The cubic model is close to it and with good features.
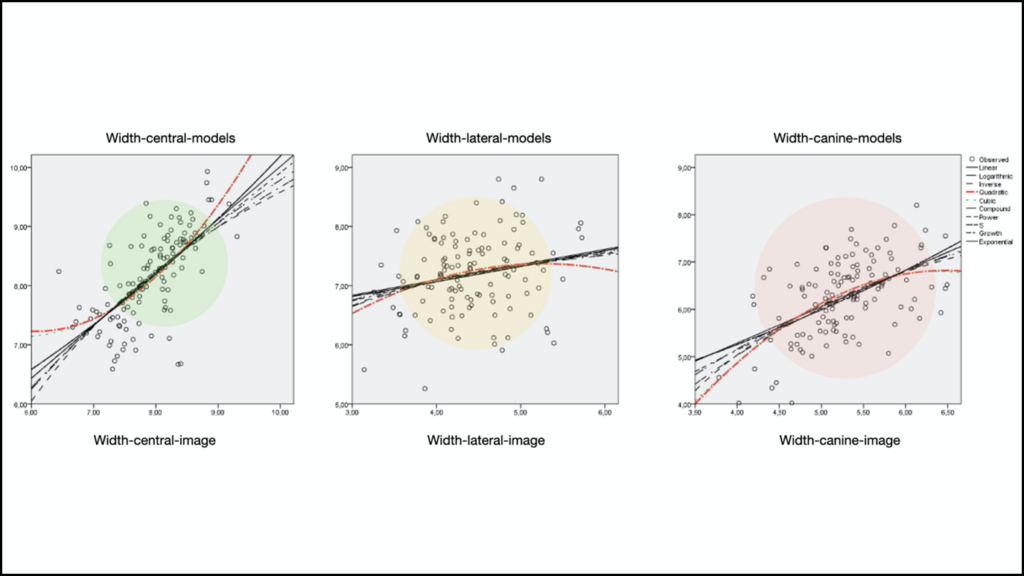
The diagram illustrates the different types of regression models with respect to the width of the upper central incisors. The points show the analyzed data—the width measured on the photo and the real width of the central incisors in the analyzed cases. The curves show the patterns studied. The closer the points are to the curve, the more accurately the corresponding model determines the real size of the teeth. The same analysis is made on the width of the lateral incisors and the canine teeth. The results obtained for the possible patterns are presented in Figure 1.
Fig. 1

The canine teeth show a significant dispersion of the points on the graph compared to the curves of the patterns, which is also confirmed by the values obtained in the analysis. This means that the actual width of canine teeth can hardly be determined by the photographs taken. This can be explained by the fact that the photographic image contains a representation of the teeth in the projection and the difference in size comes largely from the angle at which the teeth are rotated relative to the plane of the lens. In canine teeth, this angle is larger in comparison to the central incisors and lateral incisors and is not constant in all cases but varies greatly according to the anatomical features.
With regard to the height of the upper frontal teeth, it can be seen that two models also have very similar characteristics—the quadratic and the cubic ones, almost completely coinciding (Figure 2).
Fig. 2

Graphs showing the height of the teeth as measured by the photo and the real height show a small amount of dispersion of the points with regard to the obtained patterns. This is also confirmed by the higher values obtained for R Square compared to the width patterns. For the heights of the centered incisors R Square = 0.648, and for their widths R Square = 0.464. The height of the teeth can be determined with greater accuracy from the photo, rather than the width, for both the central and lateral incisors and for the canine teeth.
Discussion
Dental photography serves for documentation of clinical cases, assistance in the evaluation and diagnosis of clinical findings, documentation of the results achieved after the treatment of the patient. Along with these applications, photos are increasingly used in research in various dental disciplines.9, 10 In order to ensure accuracy and comparability of data, it is important that the information in the picture is recorded under standardized conditions.11 Standardization protocols have been developed, including all aspects of the capture process: object position, camera, formatting, light, intra- and extra-oral views. Despite the strict compliance with standardized conditions, data obtained through dental photography is difficult to be related accurately and correspond reality.12
Mobile dental photography on the other hand increases its popularity as a reliable method of dental photo documentation. Knowing the percentage of deformation and the correct lens distance, the received data can be used to determine the real sizes of the visible parts of the upper frontal teeth from mobile photo images. The figure illustrates the different types of regression models with respect to the width of the upper central incisor. The points show the analyzed data—the curves show the patterns studied. The closer the points are to the curve, the more accurately the corresponding model determines the real size of the teeth (Figures 2 & 3). The same analysis is made on the width of the lateral incisors and the canine teeth. The results obtained for the possible patterns are presented in Tables 2 & 3.
Fig. 3
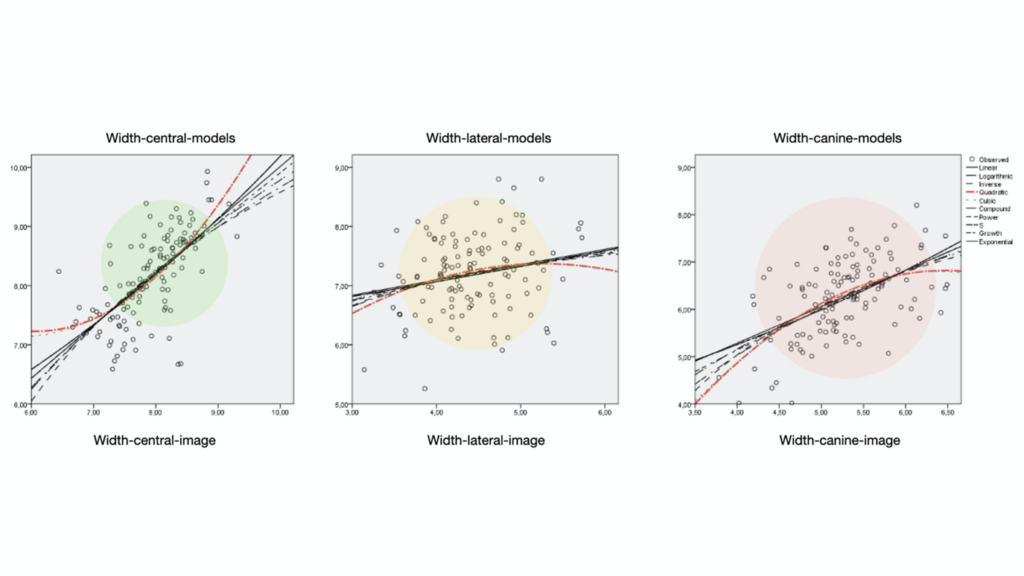
Table 3: Presents the data from the regression analysis of the width of the central incisors determined on mobile images.
Model Summary and Parameter Estimates
Dependent Variable: width of central incisor – determined on model
| Model Summary | Parameter Estimates | ||||||||
| Equation | R Square | F | df1 | df2 | Sig. | Constant | b1 | b2 | b3 |
| Linear | ,000 | ,003 | 1 | 116 | ,958 | 8,193 | -,006 | ||
| Logarithmic | ,000 | ,029 | 1 | 116 | ,864 | 8,471 | -,161 | ||
| Inverse | ,001 | ,085 | 1 | 116 | ,771 | 7,869 | 2,097 | ||
| Quadratic | ,051 | 3,075 | 2 | 115 | ,050 | 32,145 | -6,227 | ,402 | |
| Cubic | ,049 | 2,969 | 2 | 115 | ,055 | 23,876 | -3,062 | ,000 | ,017 |
| Compound | ,000 | ,000 | 1 | 116 | ,984 | 8,090 | 1,000 | ||
| Power | ,000 | ,010 | 1 | 116 | ,922 | 8,300 | -,011 | ||
| S | ,000 | ,048 | 1 | 116 | ,827 | 2,067 | ,195 | ||
| Growth | ,000 | ,000 | 1 | 116 | ,984 | 2,091 | ,000 | ||
| Exponential | ,000 | ,000 | 1 | 116 | ,984 | 8,090 | ,000 |
All teeth show a significant dispersion of the points on the graph compared to the curves of the patterns. This means that the actual width of the teeth can hardly be determined by the mobile photographs taken. With regard to the height of the upper frontal teeth, it can be seen that two models also have very similar characteristics. The differences in measurements of width and height of teeth are expected and can be explained by the optical deformation and automatic software image distortion correction and varies greatly according to the anatomical features. The height of the teeth can be determined with greater accuracy from the photo, rather than the width, for both the central and lateral incisors and for the canine teeth. However, the widths of the front teeth measured on the mobile photos range between 3.1-3.5% less than the ones obtained by digital camera, which falls within the standard deviation range. It is also visible that differences in widths measured on mobile photos with or without zoom range between 1-2.1%, which falls within the standard deviation range, and they do not play a significant role for the accuracy of the image. It also may be seen that the heights of the front teeth measured on the mobile photos range between 0.2-1.2% less than those obtained by digital camera, which falls within the standard deviation range. Differences in heights measured on mobile photos, with or without zoom, range between 0.3-0.8%, which falls within the standard deviation range, and they do not play a significant role for the accuracy of the image. The height of the teeth can be determined with greater accuracy from the photo, rather than the width, for both the central and lateral incisors and for the canine teeth. For dental purposes, using digital zoom is very important because it gives a larger and more detailed image of the teeth without changing the proportions of the image. This is also confirmed by the higher values obtained for R Square compared to the width patterns. For widths of central incisor on mobile photo without zoom R Square = 0.051, and on mobile photo without 50% zoom for their widths R Square = 0.059. From the data obtained, it may be concluded that mobile dental photography with a digital zooming could be an easy and reliable photo documentation option and the quadratic regression model, by which the real dimensions of the teeth can be reproduced, with a close approximation is most suitable.
Table 4: Presents the data from the regression analysis of the width of the central incisors determined on determined on mobile images with 2x zoom.
Model Summary and Parameter Estimates
Dependent Variable: width of central incisor – determined on model
| Model Summary | Parameter Estimates | ||||||||
| Equation | R Square | F | df1 | df2 | Sig. | Constant | b1 | b2 | b3 |
| Linear | ,051 | 6,121 | 1 | 114 | ,015 | 10,186 | -,272 | ||
| Logarithmic | ,049 | 5,832 | 1 | 114 | ,017 | 11,948 | -1,891 | ||
| Inverse | ,046 | 5,556 | 1 | 114 | ,020 | 6,415 | 12,873 | ||
| Quadratic | ,056 | 3,374 | 2 | 113 | ,038 | 6,068 | ,879 | -,080 | |
| Cubic | ,059 | 3,522 | 2 | 113 | ,033 | 7,721 | ,000 | ,067 | -,008 |
| Compound | ,045 | 5,372 | 1 | 114 | ,022 | 10,287 | ,969 | ||
| Power | ,042 | 5,044 | 1 | 114 | ,027 | 12,593 | -,219 | ||
| S | ,040 | 4,732 | 1 | 114 | ,032 | 1,894 | 1,478 | ||
| Growth | ,045 | 5,372 | 1 | 114 | ,022 | 2,331 | -,032 | ||
| Exponential | ,045 | 5,372 | 1 | 114 | ,022 | 10,287 | -,032 |
Conclusion
Measurements made on digital photos in a front aspect, may be used to determine the real values in true-to-reality digital model and vice versa. For this purpose, the quadratic regression model is most suitable. In this sense it could be implemented in novel dental software as a method for converting the two-dimensional dental design into three-dimensional true-to-reality digital model.
References
- Agrawal S, Kapoor S, Bhesania D, Shah C. Comparative photographic evaluation of various geometric and mathematical proportions of maxillary anterior teeth: A clinical study. Indian J Dent Res 2016;27:32 – 36.
- Durgekar G, Nagaraj K, Vijay N. The ideal smile and its оrthodontic implications. World Journal Of Orthodontics 2010;11:211–220.
- Ackerman B, Ackerman J. Smile analysis and design in the digital era. J Clin Orthod 2002;34:221–234.
- Ritter E, et al. Analysis of the smile photograph.World J Orthod. 2006;7: 279–285.
- Chu, St. Range and mean distribution frequency of individual tooth width of the maxillary anterior dentition. Pract Proced Aesthet Dent 2007;19:209–215.
- Strauss A, et al. Variability of facial photographs for use in treatment planning for orthodontics and orthognathic surgery. Int J Adult Orthodon Orthognath Surg 1997;12:197– 203.
- Claman L, Patton D, Rashid R. Standardzed portrait photography for dental patients. Am J Orthod Dentofacial Orthop 1990:98:197– 205.
- Orozco-Varo A, et al. Biometric analysis of the clinical crown and the width/length ratio in the maxillary anterior region. J Prosthet Dent 2015;113:565–570.
- De Carvalho Rosas G. L, et al. Photographic assessment of cephalometric measurements. Angle Orthod 2013;83:1049 –1058.
- Patel P, Trivedi R. Photography versus lateral cephalogram: role in facial diagnosis. Indian J Dent Res 2013;24:587–592.
- Vegter F, Hage J. Standardized facial photography of cleft patients: just fit the grid? Cleft Palate Craniofac J 2000; 37:435–440.
- Zhang, M. et al. Correlations between cephalometric and facial photographic measurements of craniofacial form. Am J Orthod Dentofacial Orthop 2007;13:67–71.
About the authors

Prof. Dimitar Filtchev, PhD, Professor in FDM, MU-Sofi is the Dental AI Association International Ambassador for Bulgaria, and Past President of Sofia Dental Meeting Association, cofounder of the Implant Center at the FDM- Sofia. Author over 100 scientific papers. Areas of research: implant dentistry, aesthetic dentistry; digital dentistry.

Dr. Georgi Iliev DMD, PhD, graduated with honors from the Faculty of Dental Medicine-MU, Sofia, Bulgaria. He is a member of the Bulgarian Dental Association, the Bulgarian Dental Scientific Association and an honored member of Sofia Dental Meeting Association. He is an Affiliate member of the European Academy of Esthetic Dentistry (EAED).He is running a successful private practice in two Bulgarian cities – Sofia and Vratsa since 2006 specialized in Prosthetic and Esthetic dentistry.
Prof. Zhanina Pavlova, PhD, is a Professor in FDM, MU-Sofia who has 30 years teaching experience in field of Prosthetic Dentistry. Author of 3 monography and over 75 scientific articles. Areas of scientific research: rehabilitation of masticatory system after full teeth loss; aesthetic dentistry; application of biometric indictors in Prosthetic dentistry; digital methods in Prosthetic dentistry.